Development and Validation
of a Simple RP-HPLC Method for Determination of Caffeine in Pharmaceutical
Dosage Forms
Sharmin Reza Chowdhury, Mahfuza Maleque*, Mahbubul Hoque Shihan
Department
of Pharmacy, State University of Bangladesh. Dhaka, Bangladesh.
*Corresponding
Author E-mail: mahfuza_shampa@yahoo.com
ABSTRACT:
The present study
was undertaken to develop a validated, rapid, simple and economic HPLC method
for estimating caffeine in pharmaceutical preparations. Chromatographic
determination was performed on a reversed phase C18 column (4.5 mm x 250 mm; 5
µm particle size) using a mixture of water and methanol (60:40) as mobile phase
at a flow rate of 1ml/min with UV detection at 272 nm. The method was validated
for linearity, accuracy, repeatability, precision, reproducibility, and
specificity as per International ICH guidelines. The method was also used in
determination caffeine content in five commercial brands available in
Bangladeshi market. The method was linear in the range between 12 – 28 µg/ml,
exhibited good correlation coefficient (R2 = 0.9992) and good Accuracy study
(97.35 %-100.02%). The method was found to specific for caffeine in presence of
common excipients or in presence of paracetamol in combination dosage form.
Statistical analysis performed with proposed method proved it to be precise,
accurate and reproducible. Hence it can be employed for routine analysis of
caffeine both in bulk and commercial formulations and in combination dosage
form with paracetamol.
KEYWORDS: Caffeine, HPLC, Validation, Method
development, Pharmaceutical formulations.
INTRODUCTION:
Caffeine (C8H10N4O2)
is the common name for trimethylxanthine (systematic
name is 1, 3, 7-trimethylxanthine or 3, 7-dihydro-1, 3,
7-trimethyl-1H-purine-2, 6-dione).It is an addictive stimulant. In humans, it
stimulates the central nervous system, heart rate, and respiration, has
psychotropic (mood altering) properties, and acts as a mild diuretic. Caffeine
may be used for the short-term relief of fatigue or drowsiness. It is absorbed and passes quickly
into the brain1.Caffeine is official in USP and BP and their
monograph revealed that RP- HPLC method methods were described for its estimation2, 3 . Caffeine has been
determined in combination with other drugs using UV-spectrophotometer4,
High-Performance Liquid Chromatography (HPLC)5-10, Gas
chromatography11-13, NIRS 8, 14 and Mass spectrometry12
in pharmaceutical preparations. However, most of the reported methods involve
troublesome mobile phase (buffers) and difficult detection methods such as mass
detectors.
In this study,
efforts were made on the development of a simple and easy HPLC method using
water and methanol as mobile phase with UV detection at 272 nm. The method was
optimized and validated as per the guidelines of the International Conference
on Harmonisation (ICH) 15.
MATERIAL AND METHODS:
Active drug and reagents
Standard Caffeine
powder was kindly supplied by Incepta Pharmaceutical
Ltd (Bangladesh) and was used as the reference standard. All chemicals and
reagents were of analytical or pharmaceutical grade. Excipients such as maize
starch, Avicel PH 101, sodium starch glycolate, Povidone K-30,
Magnesium stearate and purified talc were of
pharmaceutical grade.
Instrumentation and chromatographic
condition
An integrated
high performance liquid chromatography system (Shimadzu) was used for this
experiment. A C18 L1, pH resistant (4.5 mm x 250 nm: 5µm) column (Luna, Phenomenex) was used. The detecter
was set at 272 nm and the run time was 20 minutes at a flow rate of 1 ml/
minute at room temperature.
Selection of mobile phase
Initially water
(distilled and demineralized) and methanol (HPLC
grade) were used at 40:60, 50:50 and 60:40 ration as mobile phase. Finally
water and methanol were selected as the mobile phase at a ratio of 60:40 at
ambient temperature using flow rate of 1.0 ml/min and run time was set for 8
minutes.
Linearity
study
Caffeine (20mg)
was weighed accurately and taken in a 100 ml volumetric flask and water was
added to dissolve. Then enough water was added to make the final volume to 100
ml to get the stock solution (Cs). For linearity study, five aliquots in the
range of 3 to 7 ml of Cs were taken and diluted to 50 ml to obtain different concentrations
within the range 12-28 µg/ml and used for the calibration plot.
Intra-day
precision study
Accurately
weighed tablet powder, equivalent to 20 mg Caffeine, was transferred into a 100
ml volumetric flask. An amount of water (50 ml) was added, shaken for 15 min
and diluted to the 100 ml mark with same solvent. Aliquots (4, 5 and 6 ml) of
this solution was taken and respectively diluted to 50 ml with the water to
obtain three concentrations of 16, 20 and 24 µg/ml respectively. Sample was
measured in HPLC and the mean, standard deviation and RSD were calculated for
each sample.
Inter-day
precision study
The above samples
were analyzed again as the following day for inter-day precision study and the
mean, standard deviation and RSD were calculated.
Accuracy
study
This study was
carried out using 80%, 100%, 120% pure Caffeine and preformulated
granules of common excipients including maize starch, Avicel
PH 101, Sodium starch glycolate, Povidone
K-30, Magnesium stearate and purified talc etc. 120
mg granules was then transferred in to three 100 ml volumetric flasks and added
80%, 100%, 120% Caffeine active respectively into there and diluted to the 100
ml mark with water and then filtered. The solutions were analyzed by HPLC at
272 nm. for the content of Caffeine using the proposed method with a standard
solution (20 µg/ml of pure Caffeine). All analyses were carried out in
triplicate.
Specificity
in the presence of excipients
This test was
carried out using only excipients. Placebo granules devoid of the pure Caffeine
were prepared, the solutions was analyzed by HPLC at 272 nm.
Limit of
detection (LOD) and Limit of quantification (LOQ)
Limit of detection (LOD) and Limit of quantification (LOQ) for the assay
were calculated using the following equations 16
LOD = 3.3 ×S0/ b and
LOQ = 10 ×S0/ b
Where S0 and b are the standard deviation and the slope of the
calibration line.
Assay of
content of Caffeine in selected marketed brands
This was
carried out using the developed and validated method as follows-
Sample
preparation
Accurately
weighed tablet powder, equivalent to 20 mg Caffeine, was transferred into a 100
ml volumetric flask. An amount of water (50 ml) was added, shaken for 15 min
and diluted to the 100 ml mark with same solvent. It was then filtered and 5ml
of it was further diluted to 50ml to
obtain sample solution, then assayed for content of Caffeine using the proposed
method with a solution containing 20 µg/ml of pure Caffeine prepared from Cs
as standard for comparison. All analyses were carried out in triplicate.
Reference
standard preparation
5 ml of Cs was
diluted to 50 ml of water to obtain a 20 µg/ml Caffeine reference standard
solution. The sample and reference solutions were analyzed by HPLC at 272 nm. The content of Caffeine in the marketed brands was
determined using the following equation-
Content of
Caffeine (%) per tablet = (As/Ast) × (Wst/100 × 5/50) × (100/Ws × 50/5) × W × P/100
Where, As =
area of the peak of generic sample solution,
Ast =
area of the peak of reference Caffeine standard solution,
Wst =
weight of reference Caffeine powder (mg)
Ws = weight of generic powder
sample (mg)
W = average weight of tablet (mg)
P =
Potency of standard Caffeine hydrochloride
Statistical analysis
Where
applicable, results were expressed as mean ± SD and analyzed statistically.
Table 1.
Absorbance and corresponding concentrations of standard Caffeine solution
|
No of Observations |
Concentration (µg/ml) |
Area of the peak |
|
1 |
12 |
743987 |
|
2 |
16 |
1069804 |
|
3 |
20 |
1451788 |
|
4 |
24 |
1763308 |
|
5 |
28 |
2106581 |
RESULT AND
DISCUSSION:
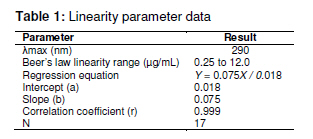
The linearity
parameter (Table 1 & Figure 1) and the corresponding
regression data, indicated excellent linear relationship (R2 =
0.9992) over the working concentration range (12 -28 µg/ml). Table 2 and Table
3 presents respectively the intra-and inter-day precision of the new method,
confirming adequate sample stability and method reliability over a 24 h period.
This is because for the three selected concentrations within the linearity
range, the observed RSDs were all < 2.0 %.
Figure 1: Calibration curve for Caffeine
Table 2:
Intra-day precision study of Caffeine
|
Intra-day Precision study( n=3 replicates) |
||||||
|
Declared Conc. (µg/ml) |
Calculated concentration
(µg/ml) |
Mean ± SD |
RSD |
Average Potency |
||
|
1 |
2 |
3 |
||||
|
16 |
15.8 |
15.9 |
15.7 |
15.8±0.10 |
0.63% |
98.75% |
|
20 |
20.1 |
19.8 |
19.8 |
19.9±0.17 |
0.87% |
99.50% |
|
24 |
23.8 |
23.9 |
23.8 |
23.8±0.05 |
0.24% |
99.29% |
Table 3:
Inter-day precision study of Caffeine
|
Inter-day Precision study( n=3 replicates) |
||||||
|
Declared Conc. (µg/ml) |
Calculated concentration
(µg/ml) |
Mean ± SD |
RSD |
Average Potency |
||
|
1 |
2 |
3 |
||||
|
16 |
15.8 |
15.8 |
15.7 |
15.76±0.057 |
0.36% |
98.50% |
|
20 |
20.1 |
19.8 |
19.8 |
19.90±0.17 |
0.87% |
99.50% |
|
24 |
23.8 |
23.9 |
23.8 |
23.83±0.057 |
0.24% |
99.29% |
Table 4:
Accuracy study of Caffeine
|
Accuracy study ( n=3) |
||||
|
Dosage form |
Labeled claim |
Amount added (%) |
Area of peak |
% Recovered |
|
Pre formulated granules |
500 mg |
80 |
1096083±0.12 |
98.6 |
|
100 |
1381916±0.58 |
99.38 |
||
|
120 |
1693813±1.05 |
100.02 |
||
Table 5:
Assay of Caffeine in marketed tablets
|
Assay of Caffeine in marketed
tablets (n=3) |
||||
|
Formulation |
Labeled claim |
Amount found ±SD |
Assay |
RSD |
|
Brand 1 |
65 mg |
64.720 ± 0.195 |
99.57% |
0.0395 |
|
Brand 2 |
65 mg |
65.637 ± 0.096 |
100.98% |
0.0196 |
|
Brand 3 |
65 mg |
98.133 ± 0.098 |
104.82% |
0.0199 |
|
Brand 4 |
65 mg |
65.845 ± 0.150 |
101.30% |
0.0302 |
The result of
Accuracy (Table 4) was within the range of ICH guideline. The % accuracy
indicated non-interference from excipients of formulation. The results of
analysis of 5 marketed brands were good and shown in Table 5. The limit of detection (LOD) and Limit of
quantification (LOQ) were calculated as 0.152 µg/ml and 0.461µg/ml
respectively.
CONCLUSION:
The results and
the statistical parameters demonstrate that the proposed HPLC method is simple,
rapid, selective, accurate, precise and highly sensitive. Therefore, it can be
used for the determination of Caffeine either in bulk or in their corresponding
dosage forms or in a combination dosage form with paracetamol without
interference from commonly used excipients and related substances whose λmax are not close to 272 nm. The proposed method is
simple and do not involve laborious time-consuming sample preparation. So this
HPLC method can be used in the quality control department.
REFERENCE:
1.
Peters
and Josef M. Factors Affecting Caffeine
Toxicity: A Review of the Literature. The
Journal of Clinical Pharmacology and the Journal of New Drugs. 7; 1967: 131–141
2. The United States Pharmacopoeia,
26th Rev., US Pharmacopoeial Convention, Inc.,
Rockville, MD. 2003
3. British Pharmacopoeia, Her
Majesty's Stationary Office, London, 2000.
4.
Izabela Muszalska, Marianna Zajic,
Grzegor Erobel and Maria Nogowska. UV/Vis Spectophotometric
methods for determination of caffeine and phenylephrine
hydrochlorid in complex pharmaceutical preparation,Validation of the methods. Acta Polomia pharmaceutica-Drug
Research. 52 (4); 2000: 247-252.
5.
M. Levent ALTUN. HPLC
Method for the Analysis of Paracetamol, Caffeine and Dipyrone.
HPLC Method for the Analysis of Pharacetamol, caffeine and Dipyrone,
Turkish Journal of Chemistry. 26; 2002: 521- 528
6.
Dalibor Sansky, Isabel Neto,
Petr Solich, Hana Sklenarova, M. Conceicao, B. S. M.
Montenegro, Alberto N. Araffljo. Sequential injection
chromatographic determination of paracetamol, caffeine and acetylsalicylic acid
in pharmaceutical tablets. Journal of
Separation Science. 27; 2004: 529–536.
7. G.
Potard, C. Laugel, A. Baillet, H. Schaefer and J. -P. Marty.
Quantitative HPLC analysis of sunscreens and
caffeine during in vitro percutaneous
penetration studies. International Journal of Pharmaceutics. 189:2; 1999: 249-260.
8. C.W. Huck, W. Guggenbichler and
G.K. Bonn. Analysis of caffeine, theobromine and theophyllin in
coffee by near infrared spectroscopy (NIRS) compared to high-performace liqid chromatography
(HPLC) coupled to mass spectrometry. Analytica Chimica Acta.
538: 1-2; 2005: 195-203.
9. Tetsuhisa
Goto, Yuko Yoshida, Masaaki Kiso
and Hitoshi Nagashima. Simultaneous
anlysis of individual catechins
and caffeine in green tea. Journal of Chromatography A. 749(1-2); 1996: 295-299.
10. Tapani
Tuomi, Tom Johnsson and
Kari Reijula. Analysis of Nicotine,
3-Hydroxycotinine, Cotinine and Caffeine in Urine of
Passive Smokers by HPLC- Tandem Mass Spectrometry. Clinical
Chemistry. 45 ; 1999 : 2164-2172.
11. Thomas PM, Foster GD. Determination of nonsteroidal anti-inflammatory druy,
caffeine and triclosan in wastewater by gas
chromatography-mass spectrometry. Journal of environmental science and health
Part A, toxic/ Hazardous substances and environmental engineering. 39 (8); 2004: 1969-78.
12. Sergei
S. Verenitch, Christopher J. Lowe and Asit Mazumder. Determination of acidic drugs and caffeine
in municipal wastewater and receiving waters by gas chromatography-ion trap
tandem mass spectrometry. Journal of Chromatography A. 1116(1-2); 2006: 193-203.
13. Carlo P. Bicchi, Ombretta M. Panero, Gloria M. Pellegrino, and Alfredo C. Vanni. Characterization of Roasted Coffee and Coffee
Beverages by Solid Phase Microextraction- Gas
Chromatography and principle component Analysis. Journal of Agricultural and
Food Chemistry. 45(12); 1997: 4680–4686.
14. Magali Laasonen, Tuulikki Harmia-Pulkkinen, Christine Simard,
Markku Ra1sa1nen and Heikki Vuorela.
Development and validation of a Near-Infrared Method for the Quantitation of caffeine in Intact Single Tablets. Analytical Chemistry. 75; 2003:754-760.
15. ICH- Harmonised Tripartity
Guideline, Validation of Analytical Procedures: Text and Methodology Q2 (R1).
IFPMA: Geneva, 2005.
16. Moustafa A. A. M. Spectrophotometric
methods for the determination of lansoprazole and pantoprazole sodium sesquihydrate.
Journal of Pharmaceutical
and Biomedical Analysis.22; 2000:45 - 58.
Received on 12.02.2012 Accepted on 28.02.2012
© Asian Pharma
Press All Right Reserved
Asian J. Pharm.
Ana. 2(1): Jan.-Mar. 2012;
Page 01-04